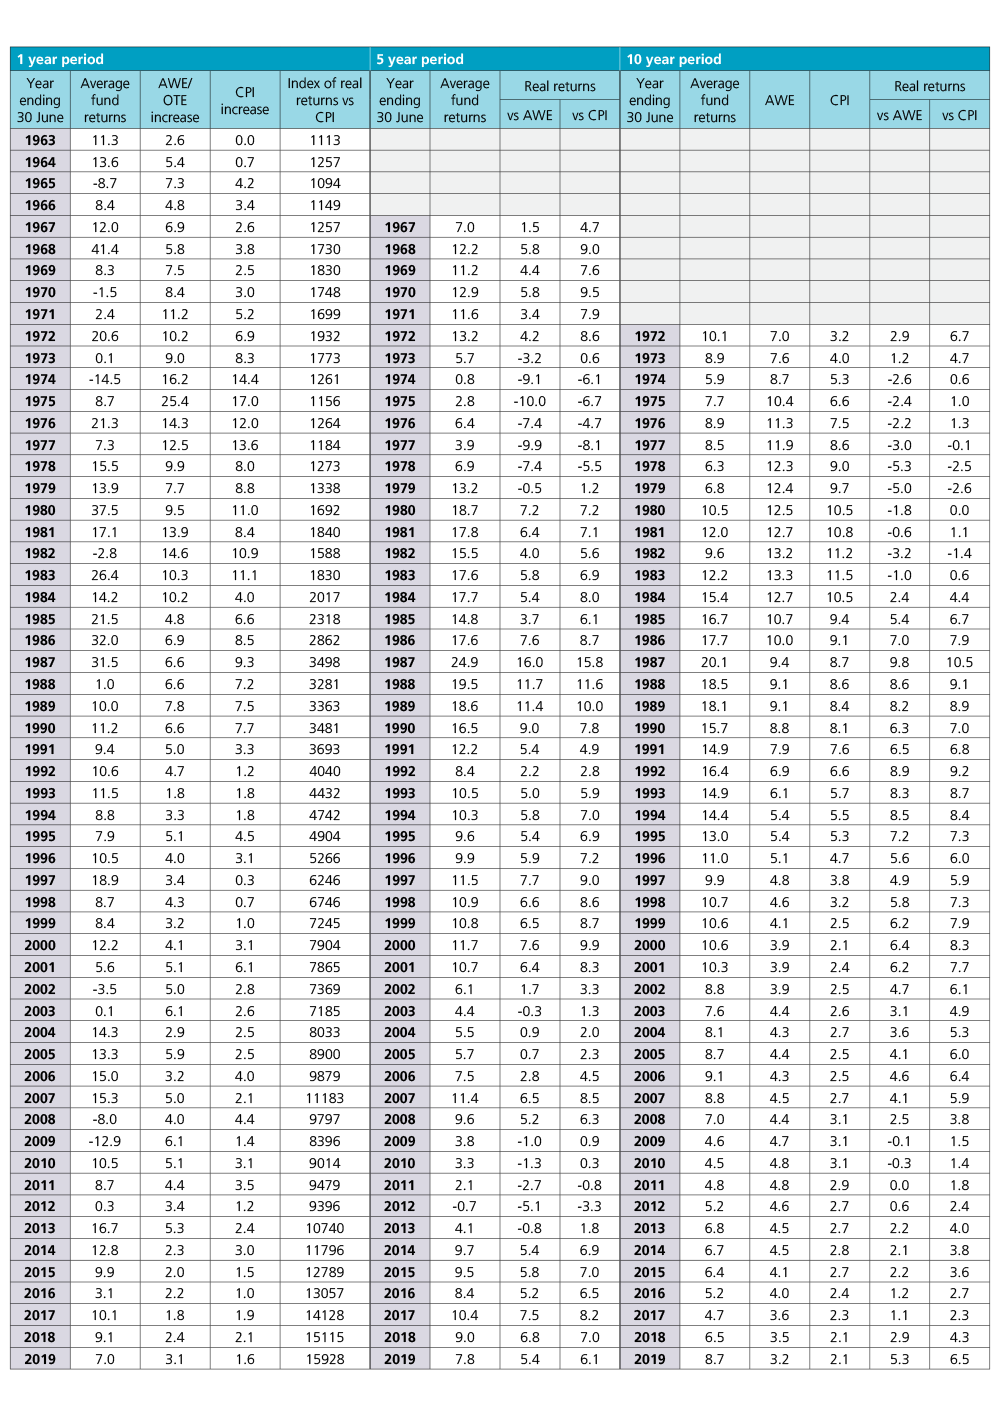
The median superannuation fund in the accumulation phase produced a return, after tax and investment fees, of 7.0 per cent for the year ending 30 June 2019. Over the 57 years of this study superannuation funds have returned 9.9 per cent per annum, exceeding Average Weekly Ordinary Time Earnings/Average Weekly Earnings (AWOTE/AWE) and price (CPI) inflation by 3.2 per cent pa and 4.9 per cent pa respectively. Table 1 depicts returns over multiple time periods to 30 June 2019. The biggest move this year was the rolling ten-year return which jumped from 6.5 percent per annum last year to 8.7 per cent per annum with the -12.9 per cent of 2009 dropping out of the series.
Table 1: Returns to 30 June 2019
| Average Fund | AWOTE | CPI | Real Returns | ||
| Returns | vs AWOTE | vs CPI | |||
| 1 Year | 7.0 | 3.1 | 1.6 | 3.8 | 5.3 |
| 5 Years | 7.8 | 2.3 | 1.6 | 5.4 | 6.1 |
| 10 Years | 8.7 | 3.2 | 2.1 | 5.3 | 6.5 |
| 15 Years | 7.1 | 3.7 | 2.4 | 3.3 | 4.6 |
| 20 Years | 6.7 | 4.0 | 2.6 | 2.6 | 4.0 |
| 25 Years | 7.5 | 4.0 | 2.5 | 3.4 | 4.9 |
| 30 Years | 7.9 | 4.0 | 2.6 | 3.7 | 5.2 |
| 35 Years | 9.4 | 4.4 | 3.3 | 4.8 | 5.9 |
| 40 Years | 10.4 | 5.3 | 4.0 | 4.8 | 6.2 |
| 45 Years | 10.7 | 6.2 | 4.9 | 4.2 | 5.5 |
| 50 Years | 9.7 | 6.6 | 5.1 | 2.9 | 4.4 |
| 57 Years | 9.9 | 6.5 | 4.8 | 3.2 | 4.9 |
In previous years I have written about the relative serenity of only looking at returns once a year and 2019 was no different. This was a positive year with members again achieving healthy returns over wage and price inflation. Underneath this however were periods of extreme volatility and uncertainty. Equity markets fell over 12 per cent during the December quarter, and then subsequently recovered to finish the year with positive returns in the order of 11 per cent for the year.
Since 30 June the news cycle has continued to gyrate with world events and themes of uncertainty continuing to pervade. The term that has intrigued me as a harbinger of fear in the recent cycle is “the market is at all-time highs”. Yes, the term is also used as a rallying call in bull markets, but at the end of July it was being put out as something to be feared, something unusual. I understand the fear component as market corrections typically come after periods of strong returns. In this study, 2019 was the tenth straight year of positive returns. So, asking the question may be warranted, but are all-time highs the thing to be feared for long-term investors?
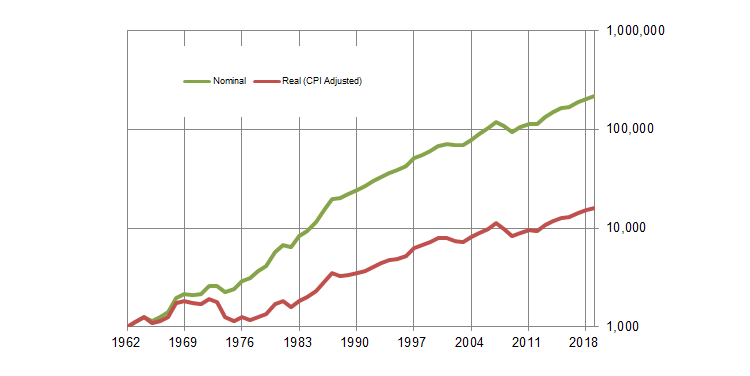
Figure 1 shows the growth of $1,000 invested in the average superannuation fund over the course of this study in both nominal and real (inflation adjusted) terms. Effectively, these are the indices underlying the return series in this study. As you can see the average superannuation fund is also positioned at an all-time high.
Figure 1: Growth of $1,000 invested in superannuation – 30 June 1962 to 2019
 Over 57 years the index has finished the year at an all-time high 77 per cent of the time – this drops to 53 per cent in real terms because of the high inflation during the 1970s and 1980s. The longest stretch of NOT being at an all-time high were the 5 years from 2008 to 2012. The longest stretch of consecutive all-time highs were the 19 years from 1983 to 2001 – a lot of the up and down of the 1987 crash happened within the 1988 financial year.
In a world of positive returns and no volatility an investment is always at an all-time high. As demonstrated by this study, even with the volatility associated with growth assets, all-time highs are the norm as opposed to being an outlier event. As always it is the fundamentals supporting the price that should be the real focus, and even then, market highs have to be considered in the context of time frames and objectives.
Cash rates are another item in the spotlight as concerns on growth see central banks around the world looking to lower rates. On 3 July 2019 the Reserve Bank of Australia took the official cash rate to an historic low of 1.00 per cent per annum. How does this look in the context of this study?
Figure 2 looks at rolling 10 year returns for the typical superannuation fund, cash returns adjusted for 15 per cent tax and CPI. The reset of inflation and inflationary expectations though the 1990s is clear, as is the corresponding fall in nominal cash rates and superannuation fund returns. Cash returns were calculated using the Bloomberg AusBond Bank Bill Index adjusted for tax at 15%.
Figure 2: Rolling Average 10 Year Returns (30 June)

Figure 2 also highlights the sharp change in the relationship between cash and inflation over multiple decades. Talking about current rates is one thing, but seeing the impact of this change over time better highlights the impact on how people think about their investments. Consider somebody allocating to cash within superannuation in 1999, they would have seen real returns against CPI of 4.7 per cent per annum for the previous 10 years. In 2009 they would have looked back and seen what they actually achieved was 1.8 per cent per annum. Roll forward another 10 years to 2019 and the gap between the return on cash and inflation is now 0.4 per cent per annum. This is a marked change and one that has clearly impacted those relying on cash in their portfolio.
This drop in real cash rates has seen investors across the board hunting out investments that can deliver higher returns. What Table 1 and Figure 2 show is the ability of the typical superannuation fund to deliver meaningful returns over inflation through a well-diversified portfolio with a healthy allocation to growth assets. For superannuation fund portfolios the answer to this low return environment has not been one silver bullet but a collection of assets that can work together towards member objectives. So, while we may be breaking into unchartered territory in some areas, many of the tools that have delivered the outstanding results in this study are as relevant as ever.
About the study
The study was first published in the June 1980 edition of Superfunds. The objective of this long-term return study is to capture the investment experience of the typical superannuation fund member. These returns have largely been derived from the average rates of return of funds participating in various surveys with returns prior to 1 July 1970 based on representative asset allocations and sector fund returns from that period. While members have a wide choice of investment options today this study can only have one number. Historically the study has used the average return of funds with growth assets between 60 and 80 per cent of assets as the representative fund. From 1 July 2015 the median return of MySuper options has been used.
This article is for general information purposes only, should not be considered as a comprehensive statement on any matter and should not be relied upon as such. It has been prepared without taking into account any recipient’s personal objectives, financial situation or needs. Because of this, recipients should, before acting on this information, consider its appropriateness having regard to their individual objectives, financial situation and needs. This information is not to be regarded as a securities recommendation. Past performance is not a reliable indicator of future performance.


