Have you or your investment governing body considered the possibility that benchmark risk is best quantified as risk of drawdown rather than standard deviation of returns? Long-term damage is caused by a decline in portfolio value, particularly when spending needs don’t subside over that troubled period. Ultimately, it is larger corrections in a portfolio’s value that destroy wealth compounding over time, even in the event that the underlying equity market ultimately recovers over several years.
We consider the Calmar ratio a more useful measure of the balance between risk and reward than more conventional measures like Sharpe ratio (which is based solely on a symmetrical measure of portfolio volatility).
Calmar ratio = Expected annualised return ÷ Max drawdown
A risk-adjusted return framework can be applied using drawdown potential as the key measure of risk. In an environment with suppressed equity return expectations, this approach can positively skew an investor’s return expectations. For some investors, a modest reduction in mean-expected return may be well worth the improvement in the event of a particularly bad path that could lie ahead.
The increasing importance of monitoring drawdown risk
Until late January 2018, the US equity market had been behaving in a consistent pattern for a few years. As chart 1 shows, corrections were short lived and so were spikes in volatility, as measured by the CBOE Volatility Index (the VIX). While the correction in Q4 2018 was longer lived, we have ultimately come back from this drawdown at least partially based on the expectation of ongoing loose monetary policy from the Federal Reserve.
Chart 1: S&P 500 and VIX since 2017
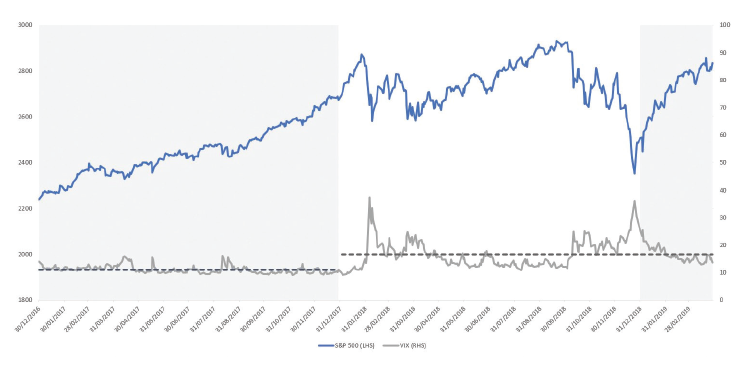
Dates: end of 2016 to end of March 2019 Source: Russell Investments and Bloomberg
Despite the recent rebound, 2018 was different than 2017, and arguably a more normal year in terms of average market volatility. The volatility spike in early 2018, however, was anything but ordinary. It was not the peak level of the VIX that was notable. It was the near record low starting point heading into the shock. The extremity of that spike can also be seen in chart 2 which shows the CBOE VIX Volatility Index (the VVIX) – this measures the volatility of the volatility index.
Chart 2: CBOE VIX Volatility Index (VVIX)
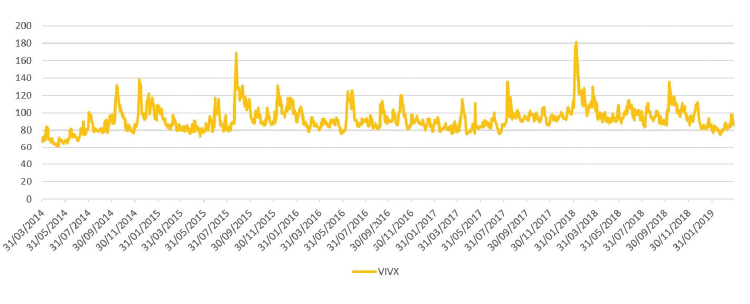
Dates: end of 2016 to end of March 2019 Source: Russell Investments and Bloomberg
While the fourth quarter of 2018 did not have the same relative increase in volatility, it involved a greater percentage drop in the underlying index and came closer to a point of capitulation before the markets rebounded. In any case, there was somewhat of a regime shift in volatility.
With that in mind, what should you fear going forward: a big spike in volatility or a more notable drop in prices? Clearly the latter scenario will create more lasting damage, particularly in the event buyers don’t return to the market for several years after the economy goes into recession. To be clear, most institutions can absorb a more instantaneous shock, as long as it is not followed by subsequent declines of a more prolonged nature. This is an important point to consider when deciding to hedge against drawdown risk resulting from exposure to equities.
In what cases, might a hedge be less appropriate?
In many cases, institutions are far enough from critical funding levels to maintain a longer investment horizon and weather a potential storm the traditional way – tolerating the bumps along the way. Other plans have a strong positive cash flow with the flexibility to increase contributions in the event of a downturn, thereby using an opportunity to “buy-low” when it presents itself. If neither of those fit your case and you decide to reduce equity drawdown risk, what might you do?
Replace equity exposure with more defensive varieties
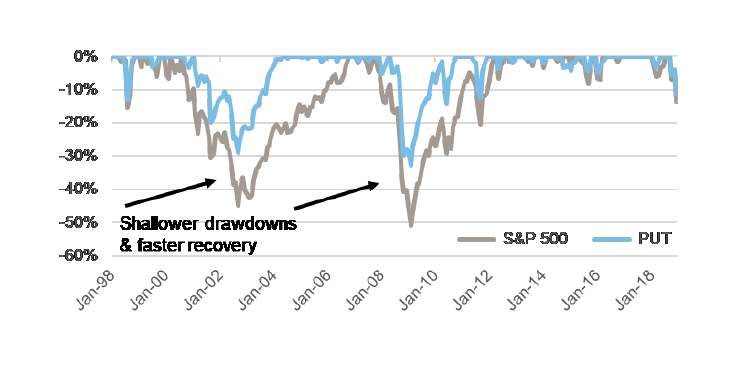
This involves selling options to generate income rather than adding hedges that decay more in value the longer an investor keeps them on. One of the more popular strategies mimics the CBOE PutWrite Index (ticker PUT). As chart 3 shows, this can generate an equity-like return pattern from the combination of enhanced cash holdings and monthly short put options struck at the money. It may sound counterintuitive that taking on downside risk to the market without upside potential could generate returns; however, harvesting the monthly premiums can provide a considerable offset to downside equity risk, as shown in chart 4. The strategy also benefits when some of those options ultimately expire worthless. In addition, it is a more strategic solution that works over long periods of time without need for tactical discretionary decisions.
Chart 3: Cumulative returns of PUT mandate vs S&P 500 over longer term
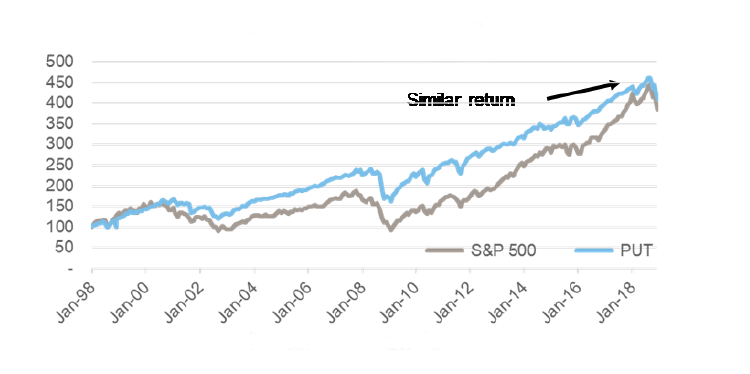
Chart 4: Historical drawdowns
Tactically hedge with options
While committee action is often required to hedge a portfolio with options, here are some things to consider when fitting hedges into a more deliberate decision-making structure.
Shorter-dated options and cross-asset hedges can challenge governance. A higher level of discretion and expertise is required to succeed here. Even those with existing investment discretion to hedge may want to consider a more deliberate approach with less potential for regret if hedge timing is not perfect.
Use longer-tenor option structures for a slower-twitch response. This approach can be much more forgiving on timing of entry and exit thus creating a wider window for success.
One-year option structures are less responsive than quarterly structures, but we believe this is a good trade-off. Time-decay (the biggest cost of option hedging), occurs at a slower rate with longer-tenor options. While tenors longer than one year are not uncommon, the reduced responsiveness of the hedge is often counterintuitive to staff if a correction occurs early in the protection term. We would suggest these only in a case of collaring expected returns over these longer horizons – this may often be an attractive means for well-funded portfolios to generate returns without the risk of falling below key funded levels.
Consider staging into a series of longer-tenor options to diversify the maturities, the entry and exit points, and the timing decisions for closing or rolling the position.
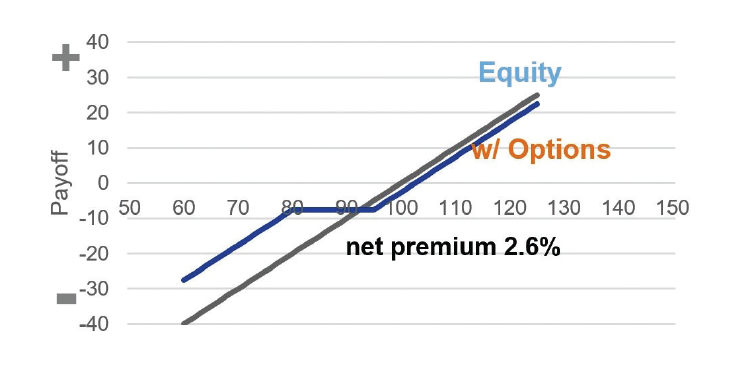
Choice of hedge type. Charts 5 and 6 illustrate the potential impact of rolling one-year put options (as well as put-spreads designed to reduce the cost). Pricing shown as of end of March specific to the S&P 500 Index.
Chart 5: Put at 95% strike
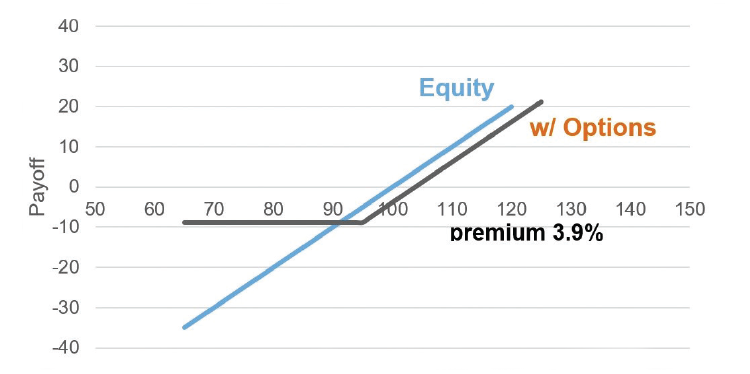
Chart 6: 95/80 Put Spread
These charts are for illustrative purposes only. Source: Russell Investments. Option pricing indicative as of March 31, 2019.
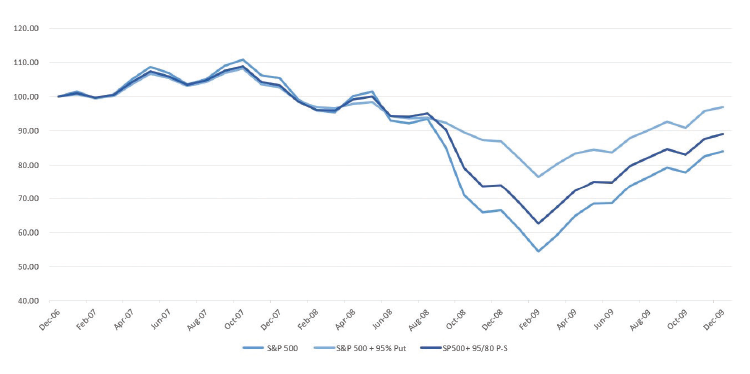
Chart 7 shows how one-year option hedges (rolled annually) behaved relative to the underlying market during the Global Financial Crisis, looking at a hedging period starting one year before the last recession and extending two years beyond the start.
Chart 7: Cumul
ative returns under stress 1yr before recession though 2yrs after recession starts
Source: Russell Investments, and Bloomberg.
As investment staff cannot watch hedge positions continuously, this slower-response option structure gives a longer window of opportunity to successfully monetise the hedge. Remember, it is also effective in protecting against the slower, more prolonged second wave down in a correction, and that is ultimately the more critical scenario to hedge. In addition, this protection is much more reasonable in cost than higher-order tail hedges that respond to more extreme volatility shocks.


