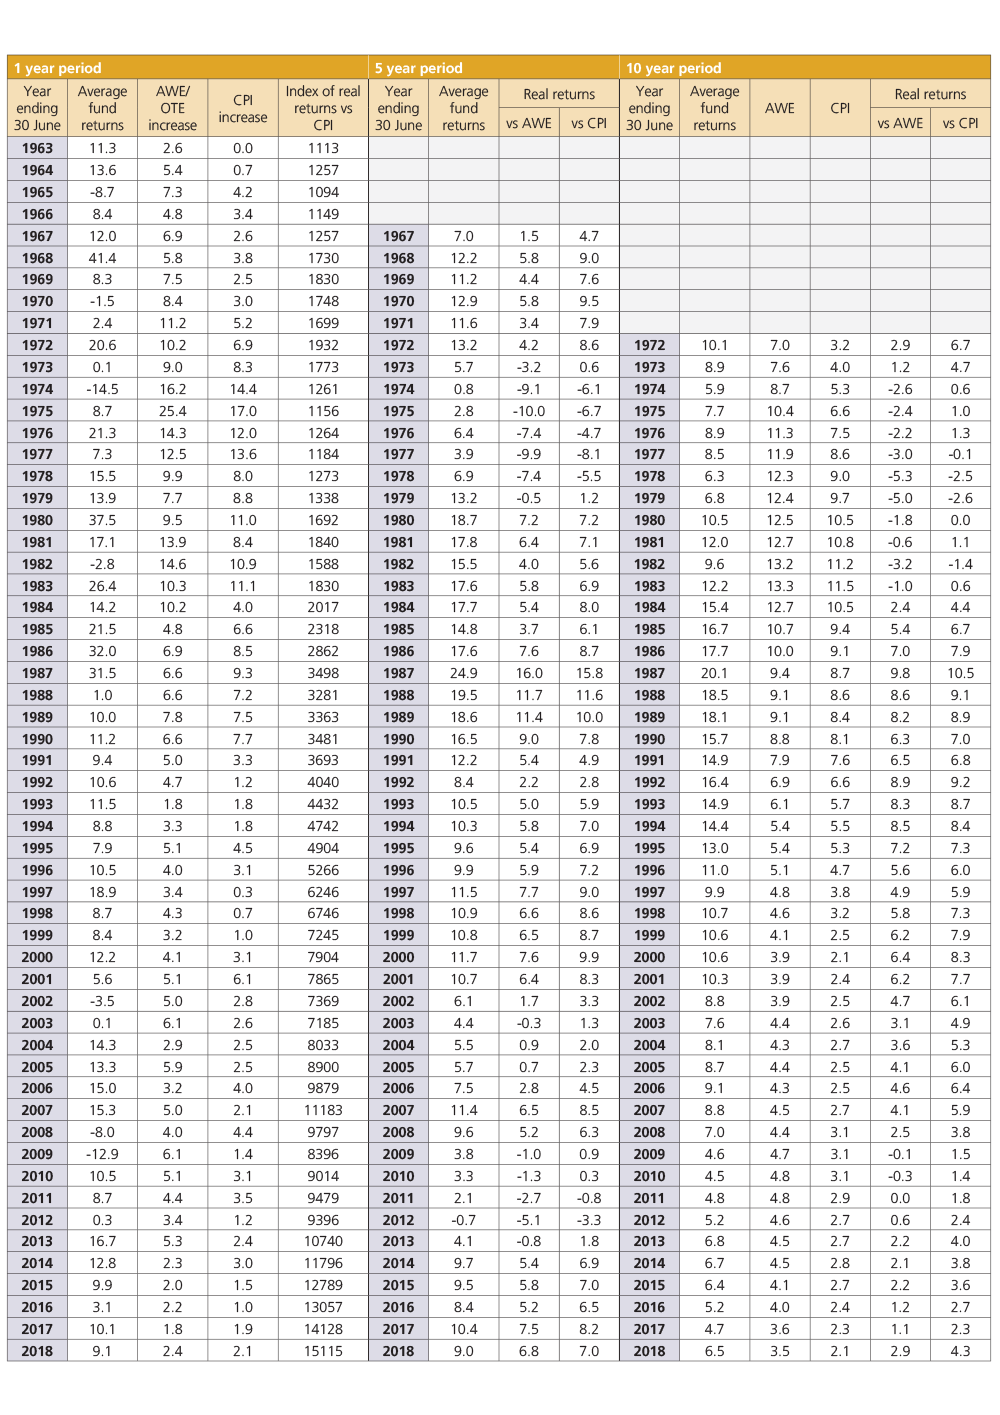
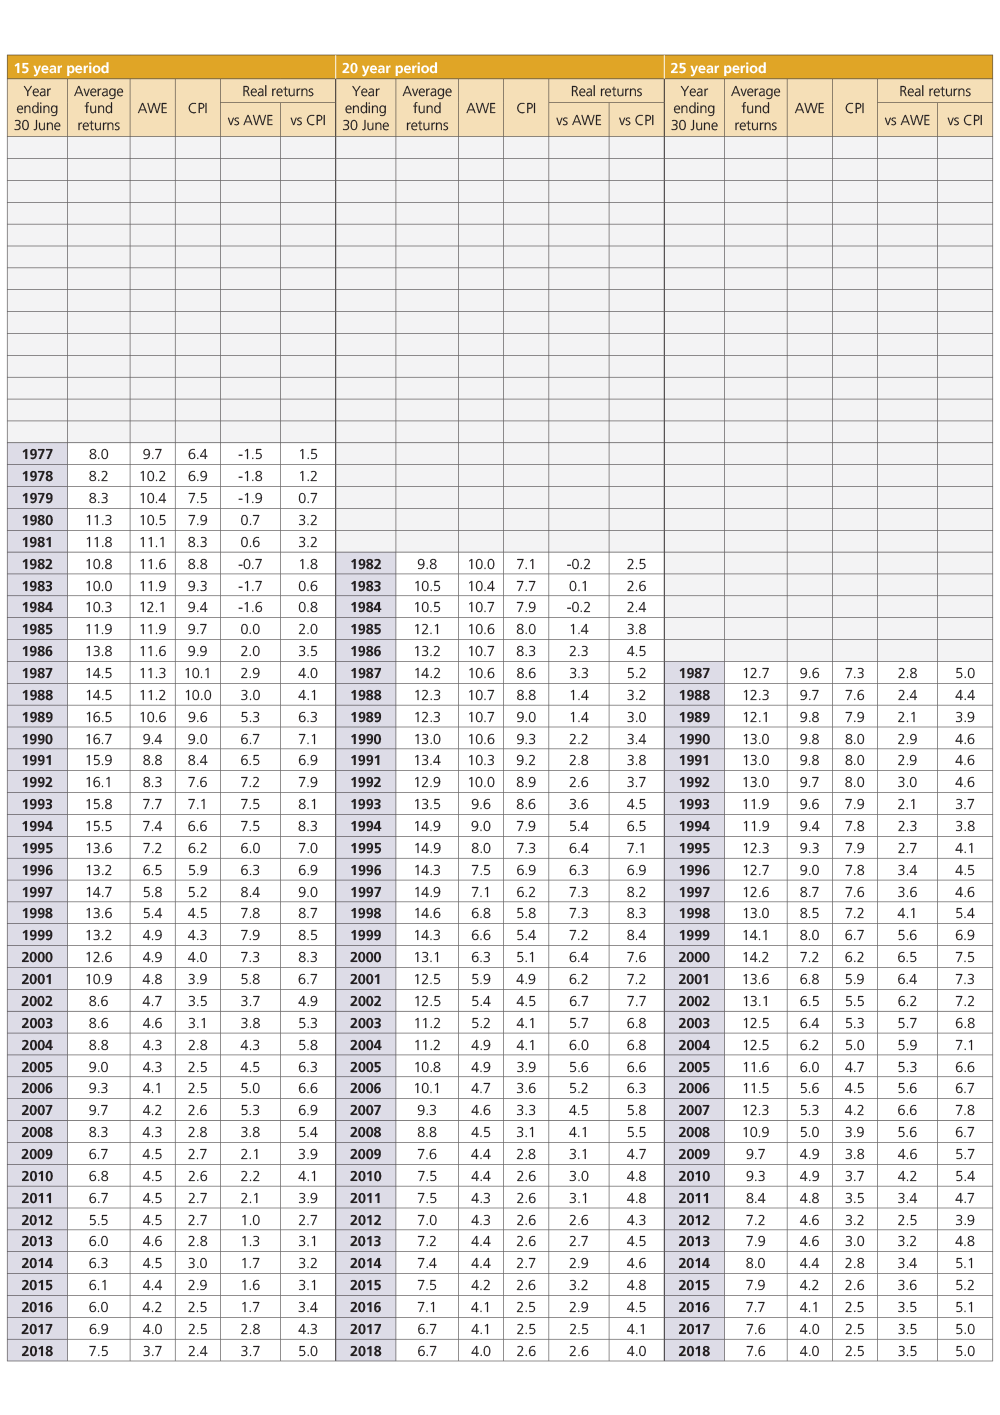
The median superannuation fund in the accumulation phase produced a return, after tax and investment fees, of 9.1 per cent for the year ending 30 June 2018. Over the 56 years of this study superannuation funds have returned 10.0 per cent per annum, exceeding Average Weekly Ordinary Time Earnings/Average Weekly Earnings (AWOTE/AWE) and price (CPI) inflation by 3.2 per cent pa and 4.9 per cent pa respectively. Table 1 depicts returns over multiple time periods to 30 June 2018. Particularly telling this time is the impact of removing the first year of the financial crisis from the ten-year return. All periods now show healthy returns over wage and price inflation.
Table 1: Returns to 30 June 2018
| Average fund returns (%) | AWE (%) |
CPI (%) |
Real returns (%) | ||
|---|---|---|---|---|---|
| vs AWOTE | vs CPI | ||||
| 1 Year | 9.1 | 2.4 | 2.1 | 6.5 | 6.8 |
| 5 Years | 9.0 | 2.1 | 1.9 | 6.8 | 7.0 |
| 10 Years | 6.5 | 3.5 | 2.1 | 2.9 | 4.3 |
| 15 Years | 7.5 | 3.7 | 2.4 | 3.7 | 5.0 |
| 20 Years | 6.7 | 4.0 | 2.6 | 2.6 | 4.0 |
| 25 Years | 7.6 | 4.0 | 2.5 | 3.5 | 5.0 |
| 30 Years | 8.0 | 4.2 | 2.8 | 3.6 | 5.1 |
| 35 Years | 9.6 | 4.6 | 3.4 | 4.8 | 6.0 |
| 40 Years | 10.6 | 5.4 | 4.2 | 4.9 | 6.1 |
| 45 Years | 10.2 | 6.5 | 5.2 | 3.5 | 4.8 |
| 50 Years | 9.7 | 6.7 | 5.1 | 2.8 | 4.4 |
| 56 Years | 10.0 | 6.6 | 4.9 | 3.2 | 4.9 |
Over the 56 years of the study there have been 7 negative returns, equating to one in every 8 years. This is now the 9th consecutive year of positive returns in nominal terms (and if history is to repeat itself another year closer to the next negative return). Taking a different perspective, in real terms (after price inflation) there have been 15 negative returns over the same period, equating to 1 in every 3.7 years. Put another way, the purchasing power of superannuation savings has gone backward twice as often as the nominal value.
The concept of short term risk for long term return is well established. As witnessed by the numbers in Table 1, superannuation returns have provided the long-term inflation adjusted returns to compensate for the risks involved. However there will still be bouts of underperformance in terms of inflation adjusted returns and, as highlighted those bouts happen more often and are more severe than the headline nominal return numbers alone.
Inflation has not reared its head for many years. If anything, the main thing attracting media headlines at present is the lack of wage inflation. AWOTE growth over the last 5 years is less than half the rate observed in the 5 years to 2013 (2.1 per cent per annum versus 4.9 per cent per annum), while inflation has remained around the 2 per cent mark. Real wage growth has clearly slowed, and people are noticing. For retirees though price inflation is the main focus.
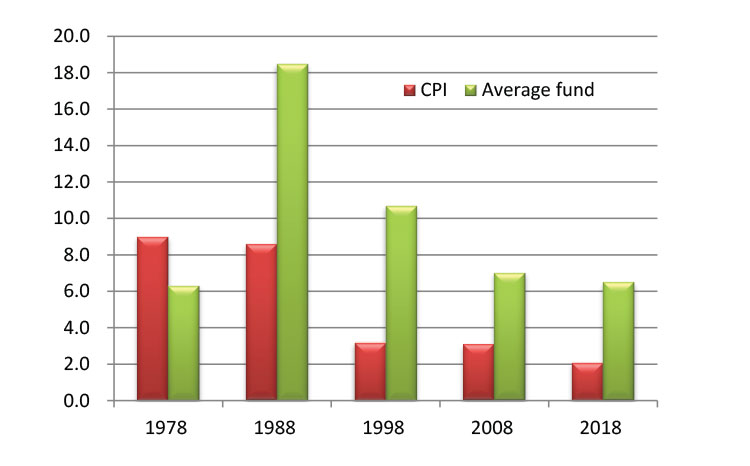
Figure 1 highlights the low inflation, low return environment of the last 10 years. Inflation has edged down in each of the last 5 decades. From the 8 per cent plus days of the 1970s and 80s, the recession inspired drops in the 90s through to the low single digit figures of this century under the watchful eye of the RBA. As inflation has dropped so have the nominal returns. The 1970s was the decade that really did the damage with inflation exceeding returns by a healthy margin. 1974 is the most discussed year with high inflation, economies slowing and plummeting equity markets but there were negative real returns in 5 additional years over that 10 year period.
Figure 1: 10 year returns to 30 June (% pa)

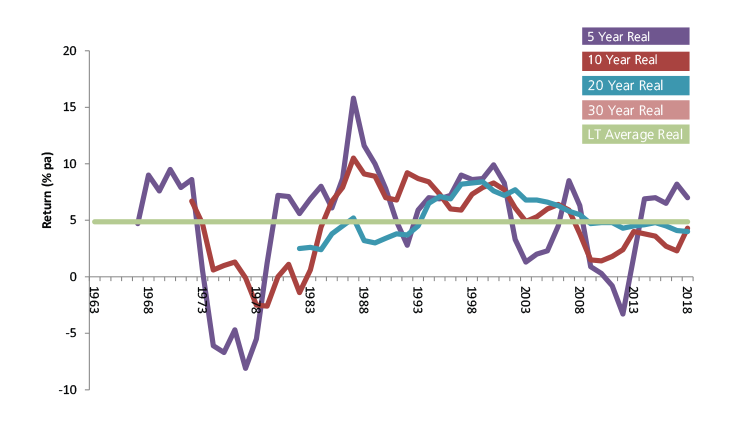
Real returns in retirement are about how long your assets will last. That question is a function of how much you need to live on each year relative to your retirement savings. In simple terms, inflation will drive up the cash outflow you need each year and more quickly erode the savings. Achieving investment returns that compensate for inflation is the key. Figure 2 looks at how rolling real returns over inflation have been trending during the accumulation phase. Pension phase returns tend to be a little higher for the same investment mix due to the absence of tax on investment earnings.
Figure 2: Rolling average real fund returns over CPI to 30 June

Figures portrayed are after tax and investment fees and should be viewed in the context of the long term trends and not as performance benchmarks. The annual returns over the past 14 years have been sourced from the Morningstar Superannuation Survey – Growth category to 30 June 2015 and MySuper category thereafter. CPI is the consumer price index, for all groups, as published by the Australian Bureau of Statistics. The real rate of return has been calculated as the ratio of the typical fund return to the rate of increase in AWOTE or CPI. Wage increases are those as published by the Australian Bureau of Statistics for full-time adults average weekly ordinary time earnings (AWOTE) from 1 July 1982 and for males average weekly total earnings prior to this. AWOTE for 2018 was based on reference period December 2016 to December 2017.
Rolling real returns over the most recent 10 and 20 years are only slightly under the long-term average of 4.9 per cent per annum. Compared to nominal returns they have been relatively stable – long term nominal returns have fallen markedly as the higher inflation periods of the 1970s and 80s fall out of the numbers.
Leaving aside any predictions of what inflation rates will do in the future, they will become more important as the number of Australians in retirement grows. Have people forgotten the destructive impact of inflation? Most likely many have. As this data shows, sustained high inflation is not something we have had to deal with for multiple decades. Are people prepared? In fact, better prepared than they know. Yes, the growth assets in these portfolios have produced negative returns but they are also the assets that have staved off the impact of inflation over the long term. On this point, Australia’s typical superannuation fund has delivered.
About the study
The study was first published in the June 1980 edition of Superfunds. The objective of this long-term return study is to capture the investment experience of the typical superannuation fund member. These returns have largely been derived from the average rates of return of funds participating in various surveys with returns prior to 1 July 1970 based on representative asset allocations and sector fund returns from that period. While members have a wide choice of investment options today this study can only have one number. Historically the study has used the average return of funds with growth assets b
etween 60 and 80 per cent of assets as the representative fund. From 1 July 2015 the median return of MySuper options has been used.


